The Role of Impact Tracking in Measuring Nonprofit Success
Learn how nonprofits can shift from counting outputs to measuring outcomes and impact, choose mission-aligned metrics, collect data, and report results.
Are your programs making a difference? Impact tracking helps nonprofits move beyond counting activities to measuring real results. Yet, 25% of organizations lack systems to track their outcomes, and only 6% effectively use data to improve strategies. This gap can limit funding and strategic growth.
Key takeaways:
- Outputs, Outcomes, Impact: Understand the difference. Outputs (e.g., meals served) show activity, while outcomes (e.g., improved health) and impact (e.g., reduced hunger) reveal meaningful change.
- Data Collection: Use simple tools for quantitative data (e.g., attendance) and qualitative insights (e.g., testimonials).
- Technology Matters: Tools like HelpYouSponsor save time, reduce errors, and improve reporting efficiency.
- Focus Metrics: Track 3–5 mission-aligned metrics to avoid data overload.
- Impact Reports: Combine data and stories to show results, build trust, and attract donors.
Impact tracking is more than a reporting tool - it’s a way to refine strategies, build donor confidence, and demonstrate the value of your work. Start small, focus on what matters, and let your results guide you.
Introduction to measuring your impact
Key Metrics for Measuring Nonprofit Impact
Understanding Outputs vs Outcomes vs Impact in Nonprofit Measurement
Outputs vs. Outcomes vs. Impact
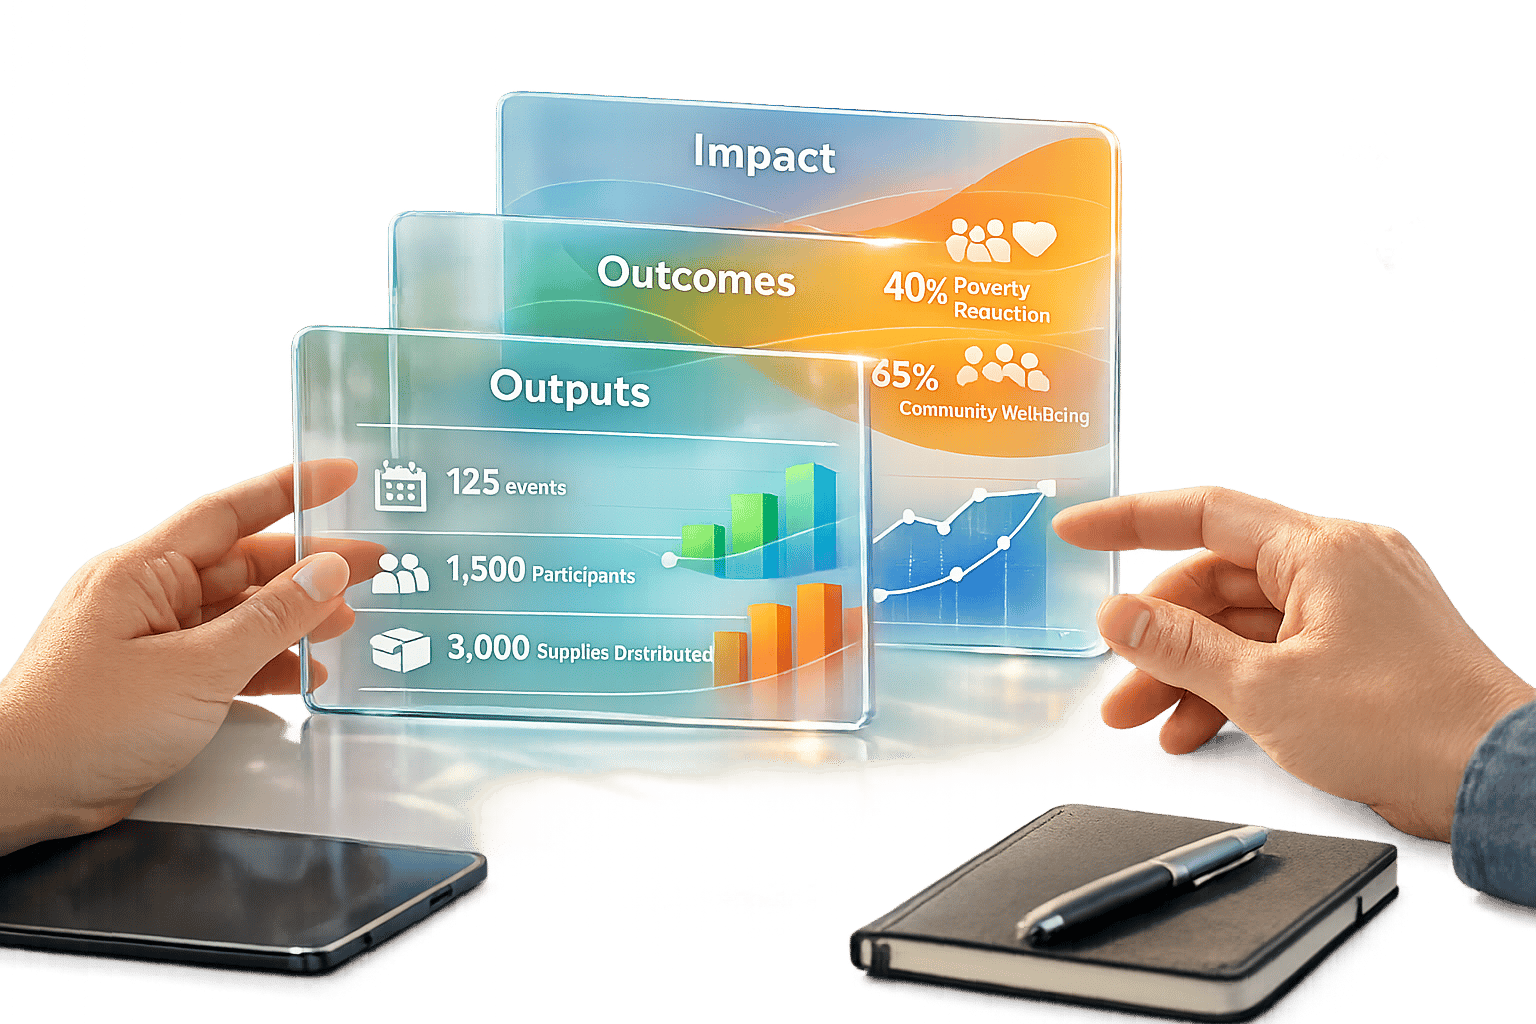
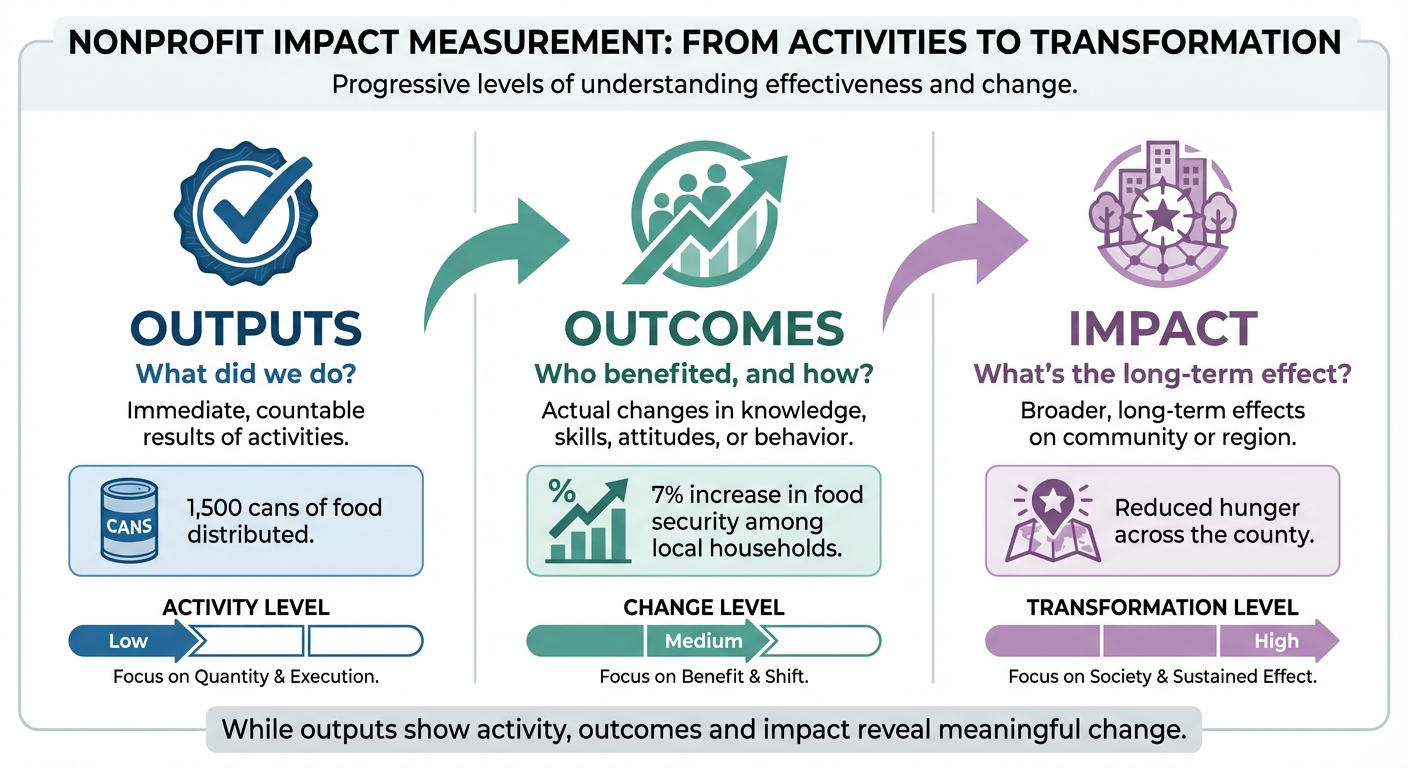
To truly measure success, it's critical to distinguish between outputs, outcomes, and impact. Outputs are the immediate, countable results of your activities - things like meals served, workshops conducted, or participants enrolled. These answer the question, "What did we do?" While outputs show activity, they don’t necessarily prove effectiveness.
Outcomes go deeper, reflecting the actual changes your work creates. These might include shifts in knowledge, skills, attitudes, or behavior - like a 20% rise in literacy rates or improved health among your target group. Outcomes answer, "Who benefited, and how?"
Finally, impact captures the broader, long-term effects of your efforts on a community or region. For example, eliminating homelessness in a specific area would represent a significant impact.
Take this example: A food pantry distributes 1,500 cans of food (output). As a result, there’s a 7% increase in food security among local households (outcome). Over time, this contributes to reducing hunger across the county (impact). While outputs are important, they don’t tell the full story - outcomes and impact reveal the meaningful change your work creates.
How to Identify Mission-Aligned Metrics
One common mistake nonprofits make is tracking too many metrics. Laura Mills from A Place Called Home puts it perfectly:
"It's easy to come up with a list of 50 measures. But in practice, nonprofits rarely have time to track distractions. If everything is important, nothing is important."
Instead, focus on three to five metrics that directly align with your mission and Theory of Change. Start by asking, "What information will help us make better decisions over the next 3–5 years?" A logic model can clarify this, showing how your inputs (like staff or funding) drive activities, which lead to outputs, outcomes, and eventually impact.
For example, A Place Called Home in Los Angeles streamlined its approach by shifting from tracking 50 measures in spreadsheets to focusing on key data points. They now monitor outputs like daily attendance and staff interactions, which inform outcomes such as higher high school graduation rates and member retention. Their ultimate goal? Raising the average education level in their zip code - a clear and mission-driven impact metric.
Methods and Tools for Data Collection
Quantitative Data Collection Strategies
To track impact effectively, reliable data collection is essential. Start with simple tools to measure direct services and tangible changes among participants. This includes tracking outputs - like the number of meals served or workshops conducted - and outcomes, such as improved test scores or increased employment rates.
Automation and case management systems can make a big difference by cutting manual data entry by 80% and reducing errors by 95%. The benefits are clear: nonprofits using data report a 75% boost in decision-making. Before adopting new tools, perform a technology audit to identify outdated systems and ensure that any upgrades align with your goals.
Free tools like Google Forms can simplify survey data collection while minimizing errors. While numbers quantify your efforts, they need context to convey their full significance.
Qualitative Data: Narratives and Testimonials
While numbers explain what happened, stories reveal why it matters. The Bridgespan Group puts it this way:
Quantitative data might tell you how many youths completed a program. Qualitative data... can reveal how that program changed their perspective, behavior, or opportunities.
Proving impact is crucial for nonprofits: 85% say it’s a top priority to attract donors, and 70% of funders require evidence of actual impact before contributing. Personal stories add depth to the numbers. You can gather these by conducting interviews, organizing focus groups, or including open-ended questions in surveys. The "Most Significant Change" technique works well: collect stories from beneficiaries, have stakeholders select the most impactful ones, and verify their authenticity.
Qualitative data shouldn’t be an afterthought. Segment feedback by demographics or program areas to uncover which strategies resonate most effectively with different groups. As Blackbaud explains:
The heart-lifting story and the solid number are both important. Mixing personal narratives with data can help your supporters see the bigger picture while still feeling emotionally connected.
Using Technology for Impact Tracking
Once you’ve built a solid foundation for data collection, the right technology can seamlessly integrate quantitative and qualitative insights. This approach transforms impact tracking into a strategic asset. Currently, 72% of nonprofits use technology to track and share outcomes - up from 57% five years ago. Modern platforms should streamline repetitive tasks, integrate with your existing systems, and grow alongside your organization.
A great example is HelpYouSponsor, which cuts manual data entry by up to 80% and saves staff 4–6 hours per week on impact reporting. The platform offers real-time dashboards for immediate access to key metrics, automated donor communication (reducing staff workload by 60%), and custom forms for collecting specific data during intake or assessments. Look for tools that measure social return on investment rather than just outputs. Features like participant and donor portals allow stakeholders to access their own impact data and updates. For visualizing data, Tableau Public is a free option that creates clear, impactful reports. Whatever tool you choose, ensure it’s secure and, if sensitive information is involved, compliant with HIPAA standards.
Creating Impact Reports for Stakeholders
What to Include in an Impact Report
An effective impact report does more than tally up activities - it shows real-world results. Instead of just stating how many meals were served or workshops held, highlight the actual changes your work has brought about, like improved health, higher literacy rates, or better job opportunities. This focus on outcomes, rather than outputs, addresses the question stakeholders care about most: Did it make a difference?
Combine hard data with personal stories. Pair statistics with testimonials from those you've helped to provide a fuller picture. Financial transparency is crucial too - break down how funds were spent and share lessons learned along the way. This kind of openness builds trust with donors who value accountability.
Everything should tie back to your mission. Each metric and story you include should clearly connect to your organization’s purpose. As John Sawhill, Director at McKinsey, put it:
The very act of aligning the mission, goals, and performance metrics of an organization can change it profoundly.
When stakeholders see how your programs directly support your mission, they’ll better understand the strategic importance of their investment. To make this even clearer, use visuals to distill complex data into easily digestible insights.
Using Visuals to Improve Clarity
Visuals can turn overwhelming data into clear, actionable insights. Use bar charts to show comparisons, line graphs for trends over time, and logic models to map your process from inputs to long-term outcomes. The trick is choosing the right visual for the data you’re presenting.
Keep designs clean and accessible. Avoid flashy 3D effects or overly colorful graphics, which can distract from your message. Stick to professional, simple designs with high contrast (4.5:1 for text and 3:1 for graphics) and ensure text is at least 11pt for readability. Don’t rely solely on color to convey meaning - add pattern fills or direct labels, making your charts usable for everyone, including colorblind readers.
To make key points stand out, use callout boxes for your most critical metrics. These highlight your "north-star" outcomes and break up dense text. Every major visual should include a brief explanation linking the data back to your mission. Busy stakeholders often skim reports, so use hierarchical headers and infographics to make your impact clear within 30 seconds.
Tailor your reports to your audience. Individual donors often respond better to personalized emails or video updates, while corporate sponsors prefer formal reports with detailed infographics showing the social return on their investment. Platforms like HelpYouSponsor can simplify this process by consolidating donor data and streamlining report creation. A well-structured report not only validates your efforts but also strengthens donor confidence in your mission-driven results.
Case Studies: Impact Tracking in Action
Small Organization Example: Tracking Impact with Limited Resources
ImmSchools, a nonprofit established in 2017 to support undocumented K–12 students, faced challenges tracking its impact with limited resources. Co-founders Viridiana Carrizales and Dr. Lorena Tule-Romain initially tried to monitor numerous metrics across their programs. However, this approach quickly became unmanageable for their small team.
The turning point came when they decided to focus on three core outcomes: students' sense of belonging, school culture, and organizational reach. This streamlined approach allowed them to showcase measurable changes. Dr. Tule-Romain shared her advice:
Start small! ... What is possible and within our reach? What are the few things we can best measure?
To ensure their efforts aligned with community needs, ImmSchools created an eight-person advisory committee made up of students and parents. They compensated members for their time and worked together to define success from the community’s perspective. By using existing intake forms and concentrating on baseline and exit data, the organization was able to measure progress effectively - without investing in costly software or complicated systems.
This example shows that even small organizations can track impact successfully by narrowing their focus, but larger programs often need more scalable solutions.
Scaling Up: Impact Tracking for Larger Programs
For A Place Called Home (APCH), a Los Angeles–based youth services agency, growth made their manual spreadsheet system unsustainable. Under the guidance of Laura Mills, Senior Director of Quality and Evaluation, APCH transitioned to Bonterra Case Management software and developed a detailed logic model. This upgrade shifted their focus from tracking simple outputs like attendance to monitoring long-term outcomes, such as improved graduation rates and member retention. The change also boosted efficiency, cutting data entry time by 35% and reducing reporting time by 40%. Mills highlighted the importance of prioritizing strategically to achieve these improvements.
Similarly, The Salvation Army Indiana Division scaled its impact reporting statewide. In December 2025, the division published its first 12-page impact report, which included precise metrics: 2,591,467 meals served, 296,897 individuals receiving social services, and 106,310 nights of safe lodging. To enhance engagement, the report incorporated QR codes linking to donation and volunteer opportunities. Duke Haddad, Ed.D., from the division, explained:
Data is powerful, but data paired with strategy, communication, and trust-building is transformational.
For organizations looking to scale their impact tracking, tools like HelpYouSponsor can simplify donor data management and streamline reporting. This allows nonprofits to showcase their results while minimizing the administrative burden on their teams.
Conclusion
Key Takeaways
Tracking impact goes beyond simply tallying numbers - it connects donor contributions to real-world changes, fostering trust and accountability. The focus has shifted from counting outputs, like meals provided, to assessing outcomes, such as higher graduation rates or healthier communities. This shift redefines how nonprofits showcase their value.
For nonprofits using data analytics, the results are striking: a 25% improvement in program outcomes and up to a 75% boost in efficiency through data-driven decision-making. However, challenges remain. A quarter of nonprofits still lack systems to measure impact, and only 6% of those collecting data feel they're using it effectively to guide strategy. This gap is both a hurdle and a chance for growth.
Regardless of size, every nonprofit can benefit from focusing on what matters most to their mission. Transparent reporting of both achievements and setbacks builds the credibility donors expect - especially when donor retention jumps from 45% to 60% after securing a second gift. With this foundation, nonprofit leaders are positioned to make meaningful strides in impact tracking.
Next Steps for Nonprofits
The time to act is now. Start by conducting a technology audit to identify and eliminate manual processes that drain resources. For instance, child sponsorship programs often dedicate up to 40% of staff time to manual tasks that could be automated. Look for tools that simplify data collection and reporting - platforms like HelpYouSponsor can manage donor information and create impact reports without overwhelming your team.
Case studies show that targeted improvements in data systems lead to measurable results. Build a culture that values data. As Tim Lockie from the Nonstop Nonprofit podcast explains:
Data is not the problem. More data is not the solution; it's the ability to knowledgeably and intentionally use the data.
Train your team to use new tools effectively, demonstrating how data can enhance everyday decisions. By focusing on meaningful metrics, nonprofits can increase transparency, strengthen donor trust, and let their impact tell a compelling story. Start small, measure wisely, and let the results speak for themselves.
FAQs
What’s the difference between outputs, outcomes, and impact in nonprofit work?
Understanding the difference between outputs, outcomes, and impact is essential for evaluating a nonprofit’s progress and effectiveness.
- Outputs refer to the direct results of your activities. Think of things like the number of meals distributed or the workshops conducted. These numbers show what your organization is actively doing but don’t necessarily reveal the broader change you're aiming for.
- Outcomes capture the short- to medium-term changes that stem from those outputs. For instance, after attending a financial literacy workshop, participants might gain budgeting skills or adopt better financial habits. These changes reflect progress but are still steps toward the bigger picture.
- Impact represents the long-term, transformative changes your organization aims to create. This could mean reducing homelessness, improving access to education, or enhancing public health. It’s about the lasting difference your efforts make in the community or society at large.
Tracking all three levels helps nonprofits showcase their effectiveness, fine-tune their strategies, and strengthen relationships with donors and stakeholders.
How can small nonprofits measure their impact with limited resources?
Small nonprofits can effectively measure their impact without needing a large budget or complex tools. The key is to focus on simple, actionable metrics that directly tie to your program goals. For instance, track things like the number of individuals served or measurable changes in behavior. Tools as basic as spreadsheets or online survey platforms can handle this kind of data collection.
Beyond numbers, gathering qualitative data - like personal testimonials or success stories - adds depth to your understanding of the difference you're making. These stories can also help you communicate your achievements in a way that resonates with donors and stakeholders. Plus, regularly reviewing this data ensures your programs stay on track and remain accountable.
By honing in on specific metrics, leveraging easy-to-use tools, and weaving in storytelling, small nonprofits can create an impact measurement system that builds trust and transparency - all while keeping costs low.
Why is it important for nonprofits to track metrics that align with their mission?
Tracking metrics that match a nonprofit's mission is crucial because it ensures the organization is measuring what truly matters - progress toward its core purpose and goals. Instead of focusing on surface-level activities or outputs, this approach zeroes in on meaningful outcomes that drive real change.
These mission-focused metrics also help build trust and accountability. When nonprofits clearly demonstrate the results of their work, they earn credibility with donors, beneficiaries, and the broader community. Showing tangible outcomes not only boosts donor confidence but also helps secure funding and encourages long-term support. This kind of impact tracking keeps nonprofits aligned with their mission while helping them refine their efforts to make a lasting difference.